Using the Nicol Graph in Teaching: An Early Years Design Exercise
Early years teachers often use a simple house project to start students off as designers. For Eco, or Bioclimatic House designs that link the indoor environment to the climate outside, the Nicol Graph provides a good first step to get students thinking about how occupants may relate to the changing weather around the site today, tomorrow and in the future.
Choosing locations that students are familiar with helps them to sensually understand the climate challenges involved so let them choose a site where they grew up in, live in today, or dream of living in the future. The following simple exercise might be delivered in one lesson and students then asked to make two or three Nicol Graphs for the following week.
When exhibited side by side students from different regions will see clearly how very different climates can be, opening minds to the idea that buildings may also vary greatly between locations. Working in groups may also promote more diverse design thinking.
Nicol Graph 1:
Building a dataset manually helps the numbers involved feel real, very different from the detached experience of automated numbers generated in computer games or models. The first Nicol Graph can be drawn using current monthly mean of the Maximum and Minimum temperatures to demonstrate how far the (Adaptive) Comfort temperature derives from the site climate. The greater the divergence between comfort and site temperatures over the year, the heavier and more robust the building needs to be to provide comfort indoors.
The success of a Bioclimatic house, can be measured in the amount of a day, month or year that the house can be run on local natural energy, without needing machines to keep people safe and healthy indoors. The wider the outdoor temperature range in which people can remain comfortable indoors when the building is using no energy for heating or cooling energy, is a critical factor for the energy used in, and emissions from, the building over a year.
The efficiency of domestic machines is of secondary concern as products change over time. It is the design and construction of the actual building that gives the primary climate protection in the long term, along with the Adaptive Opportunities it offers, such as shade devices and ventilation options in and around the structure. The width of the comfort temperature range is vitally important for the survival of the growing numbers of people who cannot afford to pay large energy bills.
Nicol Graph 2:
To get a handle on how much more extreme weather can be, even today, a second Nicol Graph can be drawn using the current Absolute Maximum and Minimum temperatures rather than their Means. Students may reflect on the vital need to enhance the climatic design of homes today to keep people safe indoors in increasingly unpredictable weather.
Nicol Graph 3:
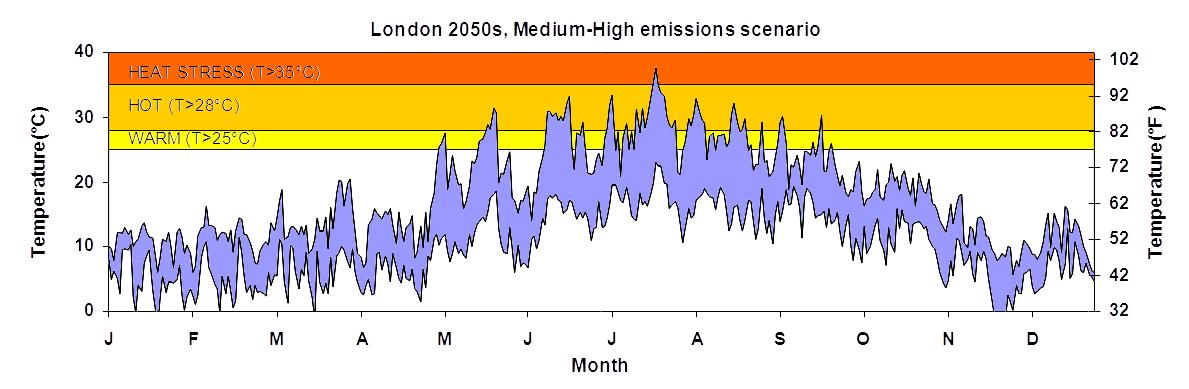
More advanced students might source future predicted climate data files for perhaps 2030, 2050, 2080 or 2100 and draw Nicol Graphs for chosen future year(s) to visually reinforce to them the scale of the future design challenges at their own site. The widening gap between current indoor Adaptive Comfort temperatures and future outdoor conditions raises questions around the extent of necessary future adaptions and how they may be achieved.
The Adaptive Comfort Principle - building Resilience for the Future.
The Adaptive Principle raises important questions that can help students think about the future. If people live in buildings which are adapted to those temperatures they normally occupy in them, what happens when those temperatures change? Will their buildings still provide safe and comfortable temperatures in a different future?People will try to Adapt.
But how far can they adapt? Exhibiting Nicol Graphs and bio-climatic house designs for different climates beside each other in class can provide valuable insights into how different cultures design for widely different climates. In clear view will be a huge range of climate-sensitive adaptive opportunities, including buildings features and furniture, and occupant attitudes and behaviours that adapted populations adopt to become - and stay - cooler or warmer, in different climates.The importance of Vernacular role model buildings.
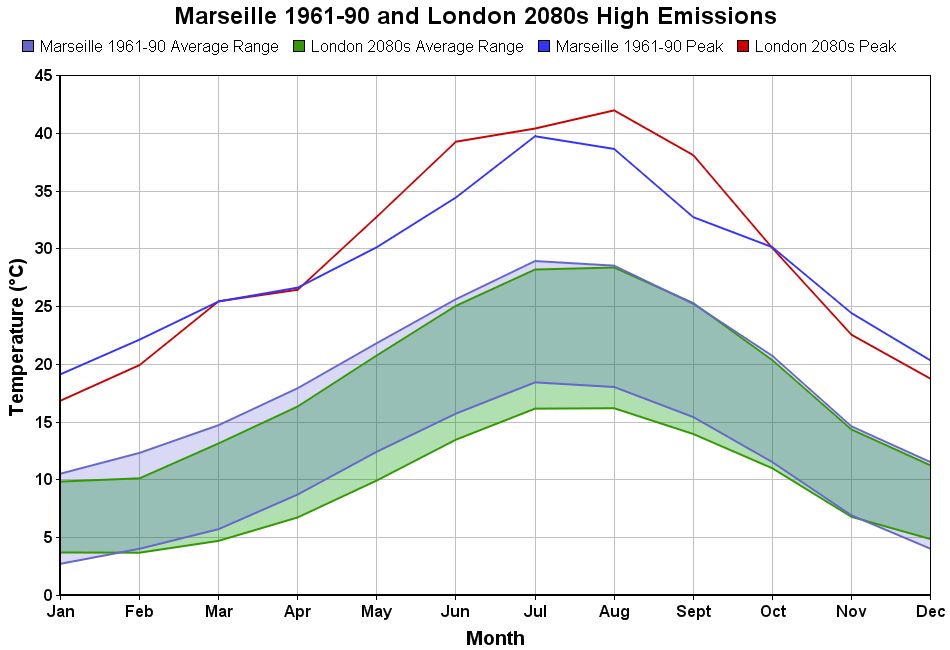
A quick way to get students to think about how they might enhance their own site design strategies for future weather is to identify a current climate that loosely resembles the future climate at their site for a particular time horizon. Designs for a chosen future climate can be guided and inspired by buildings in existing analogous climates. Arups did just this for the 2080 London climate after finding it may be similar to the climate of Marseilles in 1990 (Figs 1 and 2).A Nicol Graph is a rather crude tool
but useful for thinking about design for the future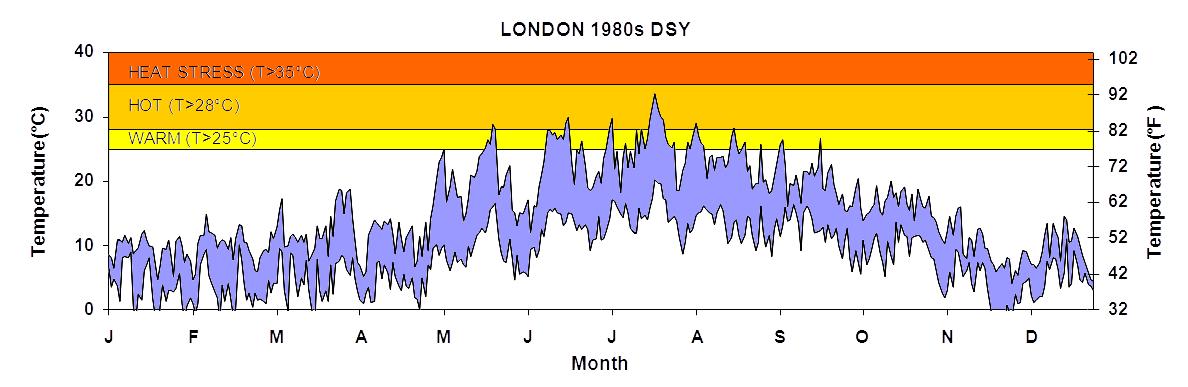
 ;
;
Further References:
For more interested designers and Masters student a good guide to Thermal Comfort is:
Nicol, F., M. Humphreys and S. Roaf (2012). Adaptive Thermal Comfort: Principals and Practice, London: Earthscan/Routledge. ISBN 978-0-415-69159-8.
For comfort researchers and PhD students see:
Humphreys. M., F. Nicol and S. Roaf (2015). Adaptive Thermal Comfort: Foundations and Analysis, London: Earthscan/Routledge. ISBN ISBN: 978-0415691611.